This is an update of a post that originally appeared here in February 2013.
Sometimes "common knowledge" is not knowledge at all...
There has been considerable hand-wringing in the press over births to women over the age of 35. According to the Telegraph, older mothers are "
driving up the birth defect rate." The New Republic suggests that older parents will "
upend American society." And Slate, generally progressive, bemoans the "
feminist fertility myth."
As a demographer, I am aware that birth rates in age groups 35-39, 40-44, and 45+ have been rising since the late 1970s for ages 35-39 and 45+, and since the early 1980s for the 40-44 set.
But as the granddaughter of a woman who birthed her youngest child when she was nearly forty, my skeptic antennae went up. My grandmother may have been a singular woman, but she was hardly a statistical aberration.
As a historical demographer, who has some experience with fertility and mortality rate trends over the past century (and
the century before), and I can say with conviction that the trend is not really new. Birth rates for women ages 35 and older are not higher now than ever. They're not even higher now than they were in the 1950s and 1960s.
The
National Vital Statistics Reports, published by the U.S. Centers for Disease Control and Prevention, provide historical birth rate data by age of mother as far back as 1970. Earlier data must be compiled from a variety of other sources including the older, and often PDF-scan-only
Monthly Vital Statistics Reports and the
U.S. Statistical Abstract.
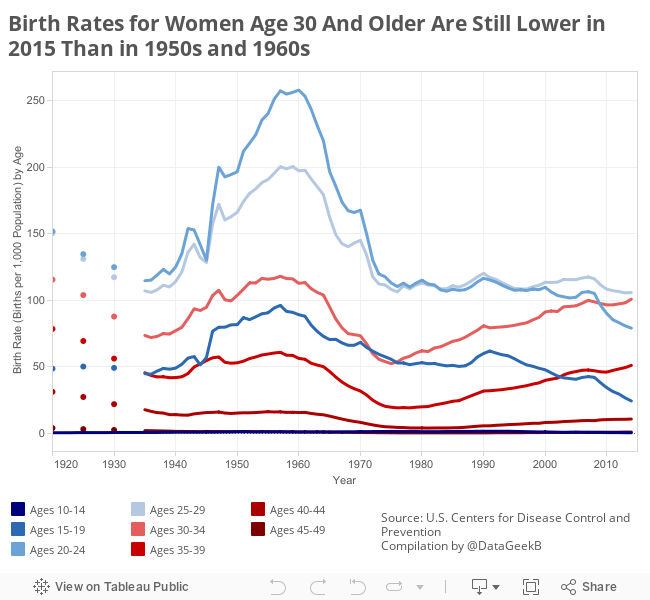
From those sources I collected data as far back as 1920, with complete annual data from 1935-2010 (the most recent year for which complete data are available). The historical birth rates (births per 1,000 women) are shown in the chart below.
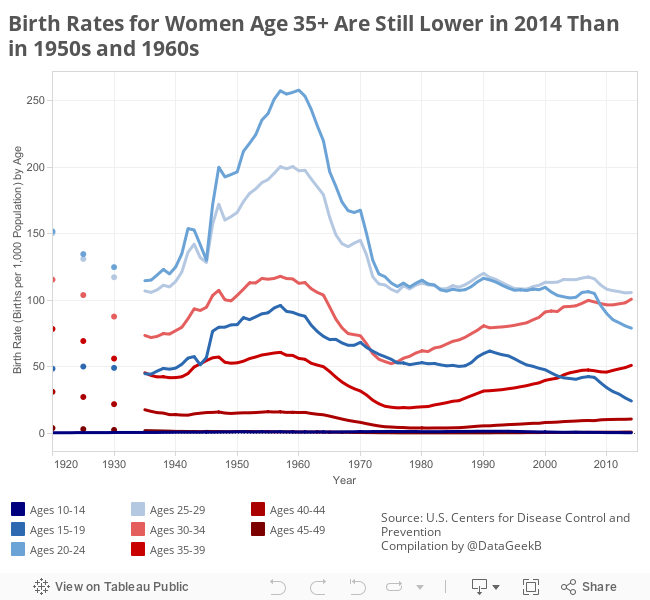
Zeroing in on ages 35 and older, to show more detail on the chart scale, we see that birth rates are indeed higher in 2010 than they were in 1970. Specifically, birth rates are 45% higher for ages 35-39, 26% higher for 40-44, and 40% higher for ages 45-49 in 2010 than in 1970.
But we do not need to go back very much farther to find a time at which birth rates were higher than they are today: In 1965 birth rates were higher for all ages 35-49 than they were in 2010.
If we go as far back as 1920, birth rates were nearly twice as high for ages 35-39, were three times higher for 40-44 year olds, and were more than 5 times higher for ages 45-49 than the rates in 2010.
In short, the phenomenon of increasing birth rates for women in their late 30s and 40s is as much a return to historical patterns as a deviation from them.
To be clear, some pregnancy risks do increase with advanced maternal age:
"older age strongly increases a woman's chances of at least three untoward outcomes—namely, stillbirth, miscarriage, and ectopic pregnancy" (Stein and Susser 2000)
However, there is considerable evidence that socio-economic factors play the most important role in birth outcome - perhaps far outweighing the age effects (
Cohen 2012,
Azimi and Lotfi 2011,
Stein and Susser 2000).
As for the current focus on trends in the past four decades, I suspect the ease of collecting data from 1970-present is partly the cause of the focus on a "huge" increase in childbearing at older ages... when, in reality, rates have fallen if you look back just 5 years more.
I am happy to share the raw data upon request. Feel free to contact me for more information.


 America's candy consumption in 2010 was nearly 25 pounds per person. If this candy were entirely Snickers bars, it would be the equivalent of nearly 4 candy bars, per week, per person. The volume of candy consumed, much like home prices, peaked in the middle of the decade, dipped at the start of the recession in 2008, and increased slowly each year since then. Another scary fact is that 2010 is the last year for which we'll have this data. Budget cuts led to the termination of the Current Industrial Reporting program.