According to the National Retail Federation, U.S. consumers will spend nearly $20 BILLION on Valentines this year. (More than half of celebrants will give candy as a gift, but most spending will be on jewelry.)
While love may be in the proverbial air, young adults are not rushing down the aisle. Median age at first marriage continues to reach new record highs (now 29.5 for men and 27.4 for women).
While age at first marriage has been increasing, and it is incredibly difficult to get an accurate measurement of the rate of divorce, by all accounts divorce rates are falling and may be at a 40-year low. By Census Bureau measures, divorce rates peaked in the years changes in divorce laws that occurred in the mid 1970s, but then leveled off and fell slightly. Some of this trend can be attributed to lower marriage rates (fewer marriages lead to fewer divorces), but some is likely a result of people waiting longer to get married in the first place.
Longer life expectancy and lower divorce rates mean that marriage duration has (on average) increased in recent years. 80 percent of marriages last at least 5 years, and 68 percent last 10 years or more, according to data compiled by the U.S. Centers for Disease Control and Prevention based on the National Survey of Family Growth (2006-2010). This is an increase from the 2002 survey, in which 78 percent of marriages last at least 5 years and two thirds last 10 years or more.
Showing posts with label fun facts. Show all posts
Showing posts with label fun facts. Show all posts
Wednesday, February 14, 2018


Sunday, October 30, 2016
Halloween Fun
Happy Halloween!
Normal Distribution vs. Paranormal Distribution
A BOOming INDUSTRY:
There were an estimated 41.1 million potential trick-or-treaters (children age 5-14*) in the United States in 2015, roughly the same as in 2014.
But Halloween is clearly not just a children's holiday. 171 million Americans of all ages will be celebrating Halloween this year (up nearly 10% from last year), with total spending reaching more than $8.4 billion.

The average American adult will spend $83 on decorations, costumes and candy, up considerably from $74 last year, and above the previous peak of $80 per person in 2012.
For those who will dress up to celebrate the holiday:
The most popular children's costume: Superhero! (knocking princess from the top spot after an 11-year reign).
Sources: National Retail Federation and U.S. Census Bureau, Facts for Features
*Note: Of course, many other children - older than 14, and younger than 5 - also go trick-or-treating.
TERRIFYING TREATS:
 America's candy consumption in 2010 was nearly 25 pounds per person. If this candy were entirely Snickers bars, it would be the equivalent of nearly 4 candy bars, per week, per person. The volume of candy consumed, much like home prices, peaked in the middle of the decade, dipped at the start of the recession in 2008, and increased slowly each year since then. Another scary fact is that 2010 is the last year for which we'll have this data. Budget cuts led to the termination of the Current Industrial Reporting program.
American confectionery manufacturers produce about 35 million pounds of candy corn each year. That adds up to 9 billion candy corns - or about 30 kernels per person in the U.S.
For Halloween itself, Americans purchase nearly 600 million pounds of candy, spending nearly $2.6 billion for treats to hand out to trick-or-treaters.
Sources: U.S. Census Bureau, Current Industrial Reports, Confectionery: 2010; National Confectioners Association; Daily Infographic 2011 and 2012
 |
| Source: Journal of Epidemiology and Community Health |
A BOOming INDUSTRY:
There were an estimated 41.1 million potential trick-or-treaters (children age 5-14*) in the United States in 2015, roughly the same as in 2014.
But Halloween is clearly not just a children's holiday. 171 million Americans of all ages will be celebrating Halloween this year (up nearly 10% from last year), with total spending reaching more than $8.4 billion.

The average American adult will spend $83 on decorations, costumes and candy, up considerably from $74 last year, and above the previous peak of $80 per person in 2012.
For those who will dress up to celebrate the holiday:
The most popular children's costume: Superhero! (knocking princess from the top spot after an 11-year reign).
Sources: National Retail Federation and U.S. Census Bureau, Facts for Features
*Note: Of course, many other children - older than 14, and younger than 5 - also go trick-or-treating.
TERRIFYING TREATS:
America's candy consumption in 2010 was nearly 25 pounds per person. If this candy were entirely Snickers bars, it would be the equivalent of nearly 4 candy bars, per week, per person. The volume of candy consumed, much like home prices, peaked in the middle of the decade, dipped at the start of the recession in 2008, and increased slowly each year since then. Another scary fact is that 2010 is the last year for which we'll have this data. Budget cuts led to the termination of the Current Industrial Reporting program.American confectionery manufacturers produce about 35 million pounds of candy corn each year. That adds up to 9 billion candy corns - or about 30 kernels per person in the U.S.
For Halloween itself, Americans purchase nearly 600 million pounds of candy, spending nearly $2.6 billion for treats to hand out to trick-or-treaters.
Sources: U.S. Census Bureau, Current Industrial Reports, Confectionery: 2010; National Confectioners Association; Daily Infographic 2011 and 2012
Wednesday, June 1, 2016
Demography of the 2016 Hurricane Season
The 2016 north Atlantic hurricane season has begun...
The coastline from Texas to North Carolina is most at risk of a hurricane, and in those states, the population of coastal counties is 27 million.
Hurricanes occasionally strike farther north, but despite hurricane Sandy's damage in 2012, such events are considerably less common than hurricanes in the southern states. Yet that does not make the damage any less catastropic. Early estimates place the damage from Hurricane Sandy at about 400,000 housing units damaged or destroyed, the majority of which were in New York (more than 300,000), New Jersey (approximately 70,000), and Connecticut (approximately 3,000).
While Sandy was more recent, and turned the lights off for more people, hurricane Katrina left more fatalities and damaged homes in her wake.
The Department of Housing and Urban Development estimates that in the summer of 2005 hurricanes Katrina, Rita, and Wilma damaged "more than one million housing units across five states." Of the damaged homes 515,000 were in Louisiana, 220,000 in Mississippi, and nearly 140,000 in Texas.
A full five years later, nearly 15 percent of the properties still had substantial visible repair needs, and 11 percent no longer contained a permanent residential structure. In other words, more than one quarter of the homes damaged in the 2005 hurricane season were either completely lost or were still in need of repair five years later.
State of Preparedness
While more than 80 percent of homes in the U.S. have a food supply sufficient for at least 3 days, only about half have a water supply in the event of an emergency.
Mapping Tools
The Bureau of Labor statistics now has an online hurricane mapper tool that provides wage,employment, and establishment data for potential flood zones.
Info at:
http://www.bls.gov/cew/hurricane_zones/home.htm
The coastline from Texas to North Carolina is most at risk of a hurricane, and in those states, the population of coastal counties is 27 million.
Hurricanes occasionally strike farther north, but despite hurricane Sandy's damage in 2012, such events are considerably less common than hurricanes in the southern states. Yet that does not make the damage any less catastropic. Early estimates place the damage from Hurricane Sandy at about 400,000 housing units damaged or destroyed, the majority of which were in New York (more than 300,000), New Jersey (approximately 70,000), and Connecticut (approximately 3,000).
While Sandy was more recent, and turned the lights off for more people, hurricane Katrina left more fatalities and damaged homes in her wake.
The Department of Housing and Urban Development estimates that in the summer of 2005 hurricanes Katrina, Rita, and Wilma damaged "more than one million housing units across five states." Of the damaged homes 515,000 were in Louisiana, 220,000 in Mississippi, and nearly 140,000 in Texas.
State of Preparedness
While more than 80 percent of homes in the U.S. have a food supply sufficient for at least 3 days, only about half have a water supply in the event of an emergency.
Mapping Tools
The Bureau of Labor statistics now has an online hurricane mapper tool that provides wage,employment, and establishment data for potential flood zones.
Info at:
http://www.bls.gov/cew/hurricane_zones/home.htm
Friday, October 30, 2015
Scary stats for Halloween 2015
A BOOming INDUSTRY:
There were an estimated 41.2 million potential trick-or-treaters (children age 5-14*) in the United States in 2014, unchanged from 2013.
But Halloween is clearly not just a children's holiday. 157 million Americans of all ages will be celebrating Halloween this year, with total spending reaching nearly $7 billion.
The average American adult will spend $74 on decorations, costumes and candy, down a bit from $78 last year, and well below the peak of $80 per person in 2012.
For those who will dress up to celebrate the holiday:
The most popular children's costume: Princess.
The most popular adult costume: Witch.
Should we read anything into that dichotomy?
The breakout costume star of 2015 is... "Star Wars character," which didn't crack the top 10 last year, but ranks 5th this year.
Sources: National Retail Federation and U.S. Census Bureau, Facts for Features
*Note: Of course, many other children - older than 14, and younger than 5 - also go trick-or-treating.
TERRIFYING TREATS:
America's candy consumption in 2010 was nearly 25 pounds per person. If this candy were entirely Snickers bars, it would be the equivalent of nearly 4 candy bars, per week, per person. The volume of candy consumed, much like home prices, peaked in the middle of the decade, dipped at the start of the recession in 2008, and increased slowly each year since then. Another scary fact is that 2010 is the last year for which we'll have this data. Budget cuts led to the termination of the Current Industrial Reporting program.
American confectionery manufacturers produce about 35 million pounds of candy corn each year. That adds up to 9 billion candy corns - or about 30 kernels per person in the U.S.
For Halloween itself, Americans purchase nearly 600 million pounds of candy, spending nearly $2.6 billion for treats to hand out to trick-or-treaters.
Sources: U.S. Census Bureau, Current Industrial Reports, Confectionery: 2010; National Confectioners Association; Daily Infographic 2011 and 2012
HOME PRICE PREMIUM NEAR FINAL RESTING PLACE
 According to Redfin (and contrary to what one might guess) homes near cemeteries sell for more, per square foot, than homes not near cemeteries.
IN THE PUMPKIN PATCH:
 U.S. pumpkin production totaled 1.3 billion pounds in 2014, with a value of $145 million. In that year 50,900 acres of farmland were harvested for pumpkins. Those figures are likely to drop in 2015 as bad weather resulted in pumpkin crop losses.
Six states are pumpkin hotspots: Illinois, California, New York, Ohio, Pennsylvania and Michigan each accounted for more than 100 million pounds of pumpkins grown in 2010.
Canadian farmers grew more than 64,700 tonnes of pumpkins, valued at $23.2 million.
Sources: USDA National Agricultural Statistics and Statistics Canada Hallowe’en... by the numbers
There were an estimated 41.2 million potential trick-or-treaters (children age 5-14*) in the United States in 2014, unchanged from 2013.
But Halloween is clearly not just a children's holiday. 157 million Americans of all ages will be celebrating Halloween this year, with total spending reaching nearly $7 billion.
The average American adult will spend $74 on decorations, costumes and candy, down a bit from $78 last year, and well below the peak of $80 per person in 2012.
For those who will dress up to celebrate the holiday:
The most popular children's costume: Princess.
The most popular adult costume: Witch.
Should we read anything into that dichotomy?
The breakout costume star of 2015 is... "Star Wars character," which didn't crack the top 10 last year, but ranks 5th this year.
Sources: National Retail Federation and U.S. Census Bureau, Facts for Features
*Note: Of course, many other children - older than 14, and younger than 5 - also go trick-or-treating.
TERRIFYING TREATS:
America's candy consumption in 2010 was nearly 25 pounds per person. If this candy were entirely Snickers bars, it would be the equivalent of nearly 4 candy bars, per week, per person. The volume of candy consumed, much like home prices, peaked in the middle of the decade, dipped at the start of the recession in 2008, and increased slowly each year since then. Another scary fact is that 2010 is the last year for which we'll have this data. Budget cuts led to the termination of the Current Industrial Reporting program.American confectionery manufacturers produce about 35 million pounds of candy corn each year. That adds up to 9 billion candy corns - or about 30 kernels per person in the U.S.
For Halloween itself, Americans purchase nearly 600 million pounds of candy, spending nearly $2.6 billion for treats to hand out to trick-or-treaters.
Sources: U.S. Census Bureau, Current Industrial Reports, Confectionery: 2010; National Confectioners Association; Daily Infographic 2011 and 2012
HOME PRICE PREMIUM NEAR FINAL RESTING PLACE
 According to Redfin (and contrary to what one might guess) homes near cemeteries sell for more, per square foot, than homes not near cemeteries.
"Redfin analyzed the price of homes less than 50 feet from a cemetery, and compared those to the price of homes less than 100, 200, 500 and 1,000 yards away. The numbers indicate that on average, homes near cemeteries are slightly smaller, but sell for more per square foot. On average, homes closest to cemeteries sold for $162 dollars per square foot, whereas the homes located more than 500 yards away sold for $145 per square foot."But these homes were on the market for longer than their non-cemetery peers...
IN THE PUMPKIN PATCH:
 U.S. pumpkin production totaled 1.3 billion pounds in 2014, with a value of $145 million. In that year 50,900 acres of farmland were harvested for pumpkins. Those figures are likely to drop in 2015 as bad weather resulted in pumpkin crop losses.
Six states are pumpkin hotspots: Illinois, California, New York, Ohio, Pennsylvania and Michigan each accounted for more than 100 million pounds of pumpkins grown in 2010.
Canadian farmers grew more than 64,700 tonnes of pumpkins, valued at $23.2 million.
Sources: USDA National Agricultural Statistics and Statistics Canada Hallowe’en... by the numbers
Thursday, February 12, 2015
Love and marriage (observations for Valentine's Day 2015)
 |
| Valentine image source |
an update of last year's popular "Love, Marriage, and a Baby Carriage," and the very popular 2013 "Love and Marriage"
Some startling observations about love and marriage in the U.S.:
- Marriages are lasting longer
- People are getting married older but "sooner"
- Condom sales are highest in February
- Home pregnancy test kit sales are highest in March
FIRST COMES LOVE, THEN COMES MARRIAGE...
Men and women in the U.S. are single longer than ever before. The average age at first marriage for women has risen to an all-time high of 26.6, and men are waiting (almost) until they turn 30.
 |
| Source: U.S. Census Bureau |
While average age at first marriage has been increasing, and it is incredibly difficult to get an accurate measurement of the rate of divorce, by all accounts divorce rates are falling. One measure shows that the rate fell from 4 divorces per 1,000 population in 2000 to 3.6 per 1,000 in 2011. By Census Bureau measures, divorce rates peaked in the years changes in divorce laws that occurred in the mid 1970s, but then leveled off and fell slightly. Some of this trend can be attributed to lower marriage rates (fewer marriages lead to fewer divorces), but some is likely a result of people waiting longer to get married in the first place.
Longer life expectancy and lower divorce rates mean that marriage duration has (on average) increased in recent years. 80 percent of marriages last at least 5 years, and 68 percent last 10 years or more, according to data compiled by the U.S. Centers for Disease Control and Prevention based on the National Survey of Family Growth (2006-2010). This is an increase from the 2002 survey, in which 78 percent of marriages last at least 5 years and two thirds last 10 years or more.
...THEN COMES... A BABY CARRIAGE?
According to many news sources, condom sales are highest in February (in the US and in India, for example). However, a National Institutes of Health study shows that increased condom sales do not necessarily translate to increased condom usage, which might explain the next phenomenon...
Nielsen research notes that sales of home pregnancy tests are higher March than any other time of the year:
Perhaps as a result of Valentine’s Day romance, more pregnancy and infertility test kits are sold approximately six weeks after Valentine’s Day than at any other time of the year. Consumers spend more than $15 million*on pregnancy and infertility test kits during the second, third and fourth weeks of March, with the third week of March ranking number one** in sales.
Notes: *Three weeks ending March 24, 2007 showed total sales of $15.4 million for pregnancy and infertility test kits in U.S. food, drug and mass merchandiser stores, including Wal-Mart. **One week ending March 24, 2007 showed total sales of $5.2 million for pregnancy and infertility test kits in U.S. food, drug and mass merchandiser stores, including Wal-Mart.
Despite the sales data, births are actually highest in late summer and early autumn, as a result of pregnancies in late autumn and early winter of the prior calendar year. This trend, known as a "seasonal cycle in fecundability" is well documented in the scientific literature.
Wednesday, February 11, 2015
My Valentine: data we love
SWEET TOOTH

To satisfy millions of sweet-toothed customers, the NECCO candy company produces approximately 100,000 pounds of Sweethearts conversation hearts each day for 11 months of the year.
This adds up more than 8 billion heart-shaped candies annually.
Data from the Census Bureau show that U.S. chocolate companies produced $13.5 billion worth of chocolate in 2011, and a 2009 study from Nielsen research showed that Valentines week accounts for more than 5 percent of annual chocolate sales.
Where does all of that chocolate come from?
Côte d'Ivoire leads global production, followed by Ghana and Indonesia.
CONSUMER SPENDING
Valentine's Day spending in the United States is expected to top $18.9 billion, according to new survey results released by the National Retail Federation. Spending is expected to be highest on jewelry ($3.9 billion) followed by $3.5 billion on an "evening out."
That works out to $142 per person celebrating the holiday. This is more than a 6 percent increase over spending in 2014, and the highest in the survey's decade-long history.
And Americans will exchange 180 million Valentine cards and 196 million roses.
FLOWER POWER
U.S. producers sold more than $16.7 million in cut roses in 2013 (estimated wholesale value for all operations with $100,000 or more in sales) according to the USDA National Agricultural Statistics Service Floriculture Crops 2013 Summary.
To support holiday spending, shoppers can choose from more than 23,000 jewelry stores and more than 14,000 florists nationwide, according to the U.S. Census Bureau County Business Patterns survey.
GEOGRAPHY OF VALENTINES
And an interactive map allows users to explore Valentine's customs around the world.

To satisfy millions of sweet-toothed customers, the NECCO candy company produces approximately 100,000 pounds of Sweethearts conversation hearts each day for 11 months of the year.
This adds up more than 8 billion heart-shaped candies annually.
Data from the Census Bureau show that U.S. chocolate companies produced $13.5 billion worth of chocolate in 2011, and a 2009 study from Nielsen research showed that Valentines week accounts for more than 5 percent of annual chocolate sales.
Where does all of that chocolate come from?
Côte d'Ivoire leads global production, followed by Ghana and Indonesia.
 |
| Source: GeoLounge |
CONSUMER SPENDING
Valentine's Day spending in the United States is expected to top $18.9 billion, according to new survey results released by the National Retail Federation. Spending is expected to be highest on jewelry ($3.9 billion) followed by $3.5 billion on an "evening out."
That works out to $142 per person celebrating the holiday. This is more than a 6 percent increase over spending in 2014, and the highest in the survey's decade-long history.
And Americans will exchange 180 million Valentine cards and 196 million roses.
FLOWER POWER
U.S. producers sold more than $16.7 million in cut roses in 2013 (estimated wholesale value for all operations with $100,000 or more in sales) according to the USDA National Agricultural Statistics Service Floriculture Crops 2013 Summary.
To support holiday spending, shoppers can choose from more than 23,000 jewelry stores and more than 14,000 florists nationwide, according to the U.S. Census Bureau County Business Patterns survey.
GEOGRAPHY OF VALENTINES
And an interactive map allows users to explore Valentine's customs around the world.
 |
| Interactive Valentines Map |
Friday, October 10, 2014
Freaky facts and scary stats for Halloween 2014
TERRIFYING TREATS:
America's candy consumption in 2010 was nearly 25 pounds per person. If this candy were entirely Snickers bars, it would be the equivalent of nearly 4 candy bars, per week, per person. The volume of candy consumed, much like home prices, peaked in the middle of the decade, dipped at the start of the recession in 2008, and increased slowly each year since then. Another scary fact is that 2010 is the last year for which we'll have this data. Budget cuts led to the termination of the Current Industrial Reporting program.
American confectionery manufacturers produce about 35 million pounds of candy corn each year. That adds up to 9 billion candy corns - or about 30 kernels per person in the U.S.
For Halloween itself, Americans purchase nearly 600 million pounds of candy, spending nearly $2 billion for treats to hand out to trick-or-treaters.
Sources: U.S. Census Bureau, Current Industrial Reports, Confectionery: 2010; National Confectioners Association; Daily Infographic 2011 and 2012
HOME PRICE PREMIUM NEAR FINAL RESTING PLACE
According to Redfin (and contrary to what one might guess) homes near cemeteries sell for more, per square foot, than homes not near cemeteries.
LITTLE GHOULS AND GOBLINS:
There were an estimated 41.2 million potential trick-or-treaters (children age 5-14*) in the United States in 2013, and 3.7 million in Canada.
Source: U.S. Census Bureau, Facts for Features and Statistics Canada Hallowe’en... by the numbers
*Note: Of course, many other children - older than 14, and younger than 5 - also go trick-or-treating.
IN THE PUMPKIN PATCH:
U.S. pumpkin production totaled 1.1 billion pounds, in 2013, with a value of $150 million. In that year 50,900 acres of farmland were harvested for pumpkins.
Six states are pumpkin hotspots: Illinois, California, New York, Ohio, Pennsylvania and Michigan each accounted for more than 100 million pounds of pumpkins grown in 2010.
In Canada, there were 7,027 acres of pumpkins patch in 2012, for production of more than 63,700 tonnes valued at $17.6 million.
Sources: USDA National Agricultural Statistics and Statistics Canada Hallowe’en... by the numbers
A BOOming INDUSTRY:
The average American adult will spend nearly $78 on decorations, costumes and candy, up a bit from $75 last year, but down from the peak of $80 per person in 2012, according to the National Retail Federation.
Total Halloween spending is projected to be nearly $7 billion.
Source: National Retail Federation
America's candy consumption in 2010 was nearly 25 pounds per person. If this candy were entirely Snickers bars, it would be the equivalent of nearly 4 candy bars, per week, per person. The volume of candy consumed, much like home prices, peaked in the middle of the decade, dipped at the start of the recession in 2008, and increased slowly each year since then. Another scary fact is that 2010 is the last year for which we'll have this data. Budget cuts led to the termination of the Current Industrial Reporting program.American confectionery manufacturers produce about 35 million pounds of candy corn each year. That adds up to 9 billion candy corns - or about 30 kernels per person in the U.S.
For Halloween itself, Americans purchase nearly 600 million pounds of candy, spending nearly $2 billion for treats to hand out to trick-or-treaters.
Sources: U.S. Census Bureau, Current Industrial Reports, Confectionery: 2010; National Confectioners Association; Daily Infographic 2011 and 2012
HOME PRICE PREMIUM NEAR FINAL RESTING PLACE
According to Redfin (and contrary to what one might guess) homes near cemeteries sell for more, per square foot, than homes not near cemeteries.
"Redfin analyzed the price of homes less than 50 feet from a cemetery, and compared those to the price of homes less than 100, 200, 500 and 1,000 yards away. The numbers indicate that on average, homes near cemeteries are slightly smaller, but sell for more per square foot. On average, homes closest to cemeteries sold for $162 dollars per square foot, whereas the homes located more than 500 yards away sold for $145 per square foot."But these homes were on the market for longer than their non-cemetery peers...
LITTLE GHOULS AND GOBLINS:
There were an estimated 41.2 million potential trick-or-treaters (children age 5-14*) in the United States in 2013, and 3.7 million in Canada.
Source: U.S. Census Bureau, Facts for Features and Statistics Canada Hallowe’en... by the numbers
*Note: Of course, many other children - older than 14, and younger than 5 - also go trick-or-treating.
IN THE PUMPKIN PATCH:
U.S. pumpkin production totaled 1.1 billion pounds, in 2013, with a value of $150 million. In that year 50,900 acres of farmland were harvested for pumpkins.Six states are pumpkin hotspots: Illinois, California, New York, Ohio, Pennsylvania and Michigan each accounted for more than 100 million pounds of pumpkins grown in 2010.
In Canada, there were 7,027 acres of pumpkins patch in 2012, for production of more than 63,700 tonnes valued at $17.6 million.
Sources: USDA National Agricultural Statistics and Statistics Canada Hallowe’en... by the numbers
A BOOming INDUSTRY:
The average American adult will spend nearly $78 on decorations, costumes and candy, up a bit from $75 last year, but down from the peak of $80 per person in 2012, according to the National Retail Federation.
Total Halloween spending is projected to be nearly $7 billion.
Source: National Retail Federation
Monday, August 25, 2014
Is August now the best month for births?
For the past few years, I've been updating data about birth seasonality and noting that September is the most common birth month of the year.
This year I was updating the data to show 2012 and 2013 births, and discovered that...
August edged out September for the most popular birth month of the year!
There is a long-standing and clear pattern of "birth seasonality" resulting from a "seasonal cycle in fecundability" documented in the scientific literature. Holidays and long winter nights are partly to blame for more birthdays in the late summer and early fall, but human biology is at work as well.
In short, in the northern hemisphere, women are more likely to get pregnant in late fall and early winter than at other times of the year. As a result more births occur late summer and early autumn, a trend displayed clearly in the chart below. (In the southern hemisphere, the seasonal peak occurs about 6 months earlier.)
What's new in the past three years is that the peak seems to have shifted a few weeks from September into August.
In the chart below, blue represents lower numbers and red highlights peaks. The left panel is total births in a given month, and the right (as explained below) shows births per day in each month.
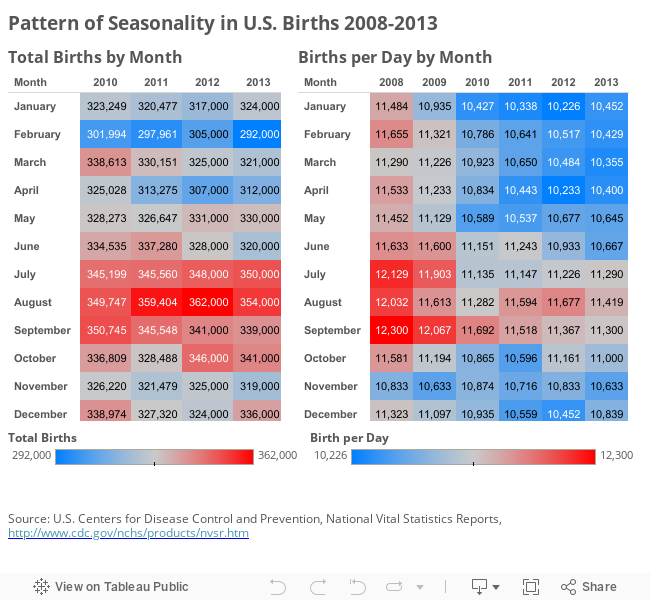 In the chart above, you may notice that March 2010 births appear high, but consider that February is a short month, and March is a 31-day month. August also has more days than neighboring month, September.
To correct for this, we can estimate the average number of births per day of the month. With this adjustment the seasonal pattern becomes even more pronounced. (See panel to the right, above.)
Correcting for the number of days per month shows September as the clear leader for births in 2008, 2009, and 2010, as it is in most years. But 2011 shows a slightly different pattern - August leads September by about 75 births per day.
And the August trend continued in 2012 and 2013! In fact, the August peak in 2012 is quite pronounced - more than 300 births per day higher than September.
The lower number of births in September 2011 may, or may not, be a consequence of a massive blizzard that shut down transportation along much of the east coast in December 2010... but the continuation of the pattern bears watching.
This year I was updating the data to show 2012 and 2013 births, and discovered that...
August edged out September for the most popular birth month of the year!
There is a long-standing and clear pattern of "birth seasonality" resulting from a "seasonal cycle in fecundability" documented in the scientific literature. Holidays and long winter nights are partly to blame for more birthdays in the late summer and early fall, but human biology is at work as well.
In short, in the northern hemisphere, women are more likely to get pregnant in late fall and early winter than at other times of the year. As a result more births occur late summer and early autumn, a trend displayed clearly in the chart below. (In the southern hemisphere, the seasonal peak occurs about 6 months earlier.)
What's new in the past three years is that the peak seems to have shifted a few weeks from September into August.
In the chart below, blue represents lower numbers and red highlights peaks. The left panel is total births in a given month, and the right (as explained below) shows births per day in each month.
To correct for this, we can estimate the average number of births per day of the month. With this adjustment the seasonal pattern becomes even more pronounced. (See panel to the right, above.)
And the August trend continued in 2012 and 2013! In fact, the August peak in 2012 is quite pronounced - more than 300 births per day higher than September.
The lower number of births in September 2011 may, or may not, be a consequence of a massive blizzard that shut down transportation along much of the east coast in December 2010... but the continuation of the pattern bears watching.
Tuesday, March 4, 2014
Stats for Shrove Tuesday
Laissez les bon temps rouler!
Fat Tuesday, Mardi Gras, Shrove Tuesday, Carnaval... by whatever name you chose, today is "the largest street fair on the planet," with an estimated 6 million revelers at Carnaval in Brazil:
Meanwhile, in the United States, New Orleans gets all the media attention for its Mardi Gras madness, but the entire Gulf Coast goes crazy for this holiday. In fact Mobile, AL is credited with the first Mardi Gras celebration in 1703 (or 1699 - depends on who you ask).
Mardi Gras revelry was suspended during the Civil War, but was revived (again) in Mobile in 1866. Legend has it that that one man, Joe Cain, rode through the streets on a coal cart, dressed in Chickasaw Indian regalia. Obviously, Joe was also drunk as a skunk (which explains a lot about Mardi Gras parades...) When Joe passed on, his second funeral procession (it's a long story) was the precursor to the big Sunday parades. Now the Sunday before Mardi Gras is now known in Mobile as "Joe Cain Day," with celebrations rivaling Fat Tuesday.

Still, New Orleans boasts the largest of U.S. celebrations. An estimated 1.4 million revelers converge on the city each year for the holiday, and guests and locals consume an estimated 500,000 king cakes between Epiphany (January 6th) and Mardi Gras. And at the two largest parades in the city, Endymion and Bacchus, krewes will distribute nearly 30 million strands of beads.
For more information...
Sociological Images has a series of several intriguing posts about Mardi Gras from a social and cultural perspective. Here is a sample of their posts:
Fat Tuesday, Mardi Gras, Shrove Tuesday, Carnaval... by whatever name you chose, today is "the largest street fair on the planet," with an estimated 6 million revelers at Carnaval in Brazil:
"There will be 14,454 policemen and 985 traffic guards on duty this Carnaval. 1,050 urban cleaning workers will collect over 600 tons of trash... 'Operation Dry Law' ticketed 786 drunk drivers; and the 'Shock of Order' seized 3,700 cans of beer, 1,100 bottles of water, 71 coolers, costumes, spray foam and cigarettes from unlicensed street vendors."
Meanwhile, in the United States, New Orleans gets all the media attention for its Mardi Gras madness, but the entire Gulf Coast goes crazy for this holiday. In fact Mobile, AL is credited with the first Mardi Gras celebration in 1703 (or 1699 - depends on who you ask).
Mardi Gras revelry was suspended during the Civil War, but was revived (again) in Mobile in 1866. Legend has it that that one man, Joe Cain, rode through the streets on a coal cart, dressed in Chickasaw Indian regalia. Obviously, Joe was also drunk as a skunk (which explains a lot about Mardi Gras parades...) When Joe passed on, his second funeral procession (it's a long story) was the precursor to the big Sunday parades. Now the Sunday before Mardi Gras is now known in Mobile as "Joe Cain Day," with celebrations rivaling Fat Tuesday.
Still, New Orleans boasts the largest of U.S. celebrations. An estimated 1.4 million revelers converge on the city each year for the holiday, and guests and locals consume an estimated 500,000 king cakes between Epiphany (January 6th) and Mardi Gras. And at the two largest parades in the city, Endymion and Bacchus, krewes will distribute nearly 30 million strands of beads.
For more information...
Sociological Images has a series of several intriguing posts about Mardi Gras from a social and cultural perspective. Here is a sample of their posts:
- Race and Mardi Gras in Mobile, AL
- Mardi Gras Krewes, tourism, and segregation
- Where the beads come from
Friday, February 14, 2014
The data we love: Fun facts for Valentine's Day
GEOGRAPHY OF VALENTINES
Facebook tries to figure out where people are falling in love. Their latest data show that people in Colorado Springs, CO are most likely to transition from a "Single" status to "In a relationship." El Paso, Louisville, Fort Worth, and San Antonio round out the top 5.
Big cities rank poorly on the Facebook relationship scale: New York and Los Angeles are in the top five least lovey-dovey cities, surpassed only by San Francisco and the District of Columbia.
And an interactive map allows users to explore Valentine's customs around the world.
CONSUMER SPENDING
Valentine's Day spending in the United States is expected to top $17.3 billion, according to new survey results released by the National Retail Federation. Spending is expected to be highest on jewelry ($3.9 billion) followed by $3.5 billion on an "evening out."
That works out to $134 per person celebrating the holiday. This is only a 2 percent increase over spending in 2013, and the highest in the survey's decade-long history.
And Americans will exchange 180 million Valentine cards.
FLOWER POWER
U.S. producers sold more than $16 million in cut roses in 2012 (estimated wholesale value for all operations with $100,000 or more in sales) according to the USDA National Agricultural Statistics Service Floriculture Crops 2012 Summary.
To support holiday spending, shoppers can choose from more than 23,000 jewelry stores and more than 15,000 florists nationwide, according to the U.S. Census Bureau County Business Patterns survey.
SWEET TOOTH
To satisfy millions of sweet-toothed customers, the NECCO candy company produces approximately 100,000 pounds of Sweethearts conversation hearts each day for 11 months of the year.
This adds up more than 8 billion heart-shaped candies annually.
Data from the Census Bureau show that U.S. chocolate companies produced $13.5 billion worth of chocolate in 2011, and a 2009 study from Nielsen research showed that Valentines week accounts for more than 5 percent of annual chocolate sales.
Facebook tries to figure out where people are falling in love. Their latest data show that people in Colorado Springs, CO are most likely to transition from a "Single" status to "In a relationship." El Paso, Louisville, Fort Worth, and San Antonio round out the top 5.
Big cities rank poorly on the Facebook relationship scale: New York and Los Angeles are in the top five least lovey-dovey cities, surpassed only by San Francisco and the District of Columbia.
 |
| Source: Wall Street Journal |
|
| Interactive Valentines Map |
CONSUMER SPENDING
Valentine's Day spending in the United States is expected to top $17.3 billion, according to new survey results released by the National Retail Federation. Spending is expected to be highest on jewelry ($3.9 billion) followed by $3.5 billion on an "evening out."
That works out to $134 per person celebrating the holiday. This is only a 2 percent increase over spending in 2013, and the highest in the survey's decade-long history.
And Americans will exchange 180 million Valentine cards.
FLOWER POWER
U.S. producers sold more than $16 million in cut roses in 2012 (estimated wholesale value for all operations with $100,000 or more in sales) according to the USDA National Agricultural Statistics Service Floriculture Crops 2012 Summary.
To support holiday spending, shoppers can choose from more than 23,000 jewelry stores and more than 15,000 florists nationwide, according to the U.S. Census Bureau County Business Patterns survey.
SWEET TOOTH
To satisfy millions of sweet-toothed customers, the NECCO candy company produces approximately 100,000 pounds of Sweethearts conversation hearts each day for 11 months of the year.
This adds up more than 8 billion heart-shaped candies annually.
Data from the Census Bureau show that U.S. chocolate companies produced $13.5 billion worth of chocolate in 2011, and a 2009 study from Nielsen research showed that Valentines week accounts for more than 5 percent of annual chocolate sales.
Thursday, October 24, 2013
Freaky facts and scary stats for Halloween 2013
TERRIFYING TREATS:
America's candy consumption in 2010 was nearly 25 pounds per person. If this candy were entirely Snickers bars, it would be the equivalent of nearly 4 candy bars, per week, per person. The volume of candy consumed, much like home prices, peaked in the middle of the decade, dipped at the start of the recession in 2008, and increased slowly each year since then.
American confectionery manufacturers produce about 35 million pounds of candy corn each year. That adds up to 9 billion candy corns - or about 30 kernels per person in the U.S.
For Halloween itself, Americans purchase nearly 600 million pounds of candy, spending nearly $2 billion for treats to hand out to trick-or-treaters.
Sources: U.S. Census Bureau, Current Industrial Reports, Confectionery: 2010; National Confectioners Association; Daily Infographic 2011 and 2012
HOME PRICE PREMIUM NEAR FINAL RESTING PLACE
According to Redfin (and contrary to what one might guess) homes near cemeteries sell for more, per square foot, than homes not near cemeteries.
LITTLE GHOULS AND GOBLINS:
There were an estimated 41.1 million potential trick-or-treaters (children age 5-14*) in the United States in 2012, and 3.7 million in Canada.
Source: U.S. Census Bureau, Facts for Features and Statistics Canada Hallowe’en... by the numbers
*Note: Of course, many other children - older than 14, and younger than 5 - also go trick-or-treating.
IN THE PUMPKIN PATCH:
U.S. pumpkin production totaled 1.2 billion pounds, in 2012, with a value of $149 million. In that year 47,800 acres of farmland were under cultivation for pumpkins.
Six states are pumpkin hotspots: Illinois, California, New York, Ohio, Pennsylvania and Michigan each accounted for more than 100 million pounds of pumpkins grown in 2010.
In Canada, there were 7,027 acres of pumpkins patch in 2012, for production of more than 63,700 tonnes valued at $17.6 million.
Sources: USDA National Agricultural Statistics and Statistics Canada Hallowe’en... by the numbers
A BOOming INDUSTRY:
The average American adult will spend nearly $75 on decorations, costumes and candy, down a bit from $80 per person last year, according to the National Retail Federation.
Total Halloween spending is projected to be nearly $7 billion.
Source: National Retail Federation
America's candy consumption in 2010 was nearly 25 pounds per person. If this candy were entirely Snickers bars, it would be the equivalent of nearly 4 candy bars, per week, per person. The volume of candy consumed, much like home prices, peaked in the middle of the decade, dipped at the start of the recession in 2008, and increased slowly each year since then.American confectionery manufacturers produce about 35 million pounds of candy corn each year. That adds up to 9 billion candy corns - or about 30 kernels per person in the U.S.
For Halloween itself, Americans purchase nearly 600 million pounds of candy, spending nearly $2 billion for treats to hand out to trick-or-treaters.
Sources: U.S. Census Bureau, Current Industrial Reports, Confectionery: 2010; National Confectioners Association; Daily Infographic 2011 and 2012
HOME PRICE PREMIUM NEAR FINAL RESTING PLACE
According to Redfin (and contrary to what one might guess) homes near cemeteries sell for more, per square foot, than homes not near cemeteries.
"Redfin analyzed the price of homes less than 50 feet from a cemetery, and compared those to the price of homes less than 100, 200, 500 and 1,000 yards away. The numbers indicate that on average, homes near cemeteries are slightly smaller, but sell for more per square foot. On average, homes closest to cemeteries sold for $162 dollars per square foot, whereas the homes located more than 500 yards away sold for $145 per square foot."But these homes were on the market for longer than their non-cemetery peers...
LITTLE GHOULS AND GOBLINS:
There were an estimated 41.1 million potential trick-or-treaters (children age 5-14*) in the United States in 2012, and 3.7 million in Canada.
Source: U.S. Census Bureau, Facts for Features and Statistics Canada Hallowe’en... by the numbers
*Note: Of course, many other children - older than 14, and younger than 5 - also go trick-or-treating.
IN THE PUMPKIN PATCH:
U.S. pumpkin production totaled 1.2 billion pounds, in 2012, with a value of $149 million. In that year 47,800 acres of farmland were under cultivation for pumpkins.Six states are pumpkin hotspots: Illinois, California, New York, Ohio, Pennsylvania and Michigan each accounted for more than 100 million pounds of pumpkins grown in 2010.
In Canada, there were 7,027 acres of pumpkins patch in 2012, for production of more than 63,700 tonnes valued at $17.6 million.
Sources: USDA National Agricultural Statistics and Statistics Canada Hallowe’en... by the numbers
A BOOming INDUSTRY:
The average American adult will spend nearly $75 on decorations, costumes and candy, down a bit from $80 per person last year, according to the National Retail Federation.
Total Halloween spending is projected to be nearly $7 billion.
Source: National Retail Federation
Saturday, September 14, 2013
Why is September a common birthday month?
Note: This post is adapted from last year's post and includes new data and analysis...
Do you feel like you're spending a small fortune on birthday cards every September? Is your Facebook feed alight with birthday reminders this month? Have you noticed more birthday party invitations arriving in the mail in recent weeks?
If you have noticed a spike, you are not alone. There is a clear pattern of "birth seasonality" resulting from a "seasonal cycle in fecundability" documented in the scientific literature. Holidays and long winter nights are partly to blame for more birthdays in September, but human biology is at work as well.
In short, in the northern hemisphere, women are more likely to get pregnant in late fall and early winter than at other times of the year. As a result more births occur late summer and early autumn, a trend displayed clearly in the chart below with birth data from the United States in 2010 and 2011. (Note: In the southern hemisphere, the seasonal peak occurs about 6 months earlier.)
In the chart above, you may notice that March 2010 births appear high, but consider that February is a short month, and March is a 31-day month. August also has more days than neighboring month, September.
To correct for this, we can estimate the average number of births per day of the month. With this adjustment the seasonal pattern becomes even more pronounced.
Correcting for the number of days per month shows September as the clear leader for births in 2010, as it is in most years. But 2011 shows a slightly different pattern - August leads September by about 75 births per day.
The lower number of births in September 2011 may, or may not, be a consequence of a massive blizzard that shut down transportation along much of the east coast in December 2010...
Do you feel like you're spending a small fortune on birthday cards every September? Is your Facebook feed alight with birthday reminders this month? Have you noticed more birthday party invitations arriving in the mail in recent weeks?
If you have noticed a spike, you are not alone. There is a clear pattern of "birth seasonality" resulting from a "seasonal cycle in fecundability" documented in the scientific literature. Holidays and long winter nights are partly to blame for more birthdays in September, but human biology is at work as well.
In short, in the northern hemisphere, women are more likely to get pregnant in late fall and early winter than at other times of the year. As a result more births occur late summer and early autumn, a trend displayed clearly in the chart below with birth data from the United States in 2010 and 2011. (Note: In the southern hemisphere, the seasonal peak occurs about 6 months earlier.)
 |
| Source: U.S. Centers for Disease Control and Prevention and author's calculations |
To correct for this, we can estimate the average number of births per day of the month. With this adjustment the seasonal pattern becomes even more pronounced.
 |
| Source: U.S. Centers for Disease Control and Prevention and author's calculations |
The lower number of births in September 2011 may, or may not, be a consequence of a massive blizzard that shut down transportation along much of the east coast in December 2010...
Wednesday, February 13, 2013
Valentine's by the numbers
GLOBAL VALENTINES
An interactive map allows users to explore Valentine's customs around the world.
CONSUMER SPENDING
Valentine's Day spending in the United States is expected to top $17.6 billion, according to new survey results released by the National Retail Federation.
Spending is expected to be highest on jewelry ($4.1 billion) followed by $3.5 billion on a date, $1.8 billion on flowers, $1.5 billion on candy, with the balance accounted for by clothing, gift cards, and other items.
That works out to $126 per person celebrating the holiday. This is an 8.5 percent increase over spending in 2012, and the highest in the survey's decade-long history.
FLOWER POWER
U.S. producers sold more than $18 million in cut roses in 2011 (estimated wholesale value for all operations with $100,000 or more in sales).
Source: USDA National Agricultural Statistics Service Floriculture Crops 2011 Summary
To support holiday spending, shoppers can choose from nearly 24,000 jewelry stores and more than 16,000 florists nationwide.
Source: U.S. Census Bureau, County Business Patterns
SWEET TOOTH
To satisfy millions of sweet-toothed customers, the NECCO candy company produces approximately 100,000 pounds of Sweethearts conversation hearts each day for 11 months of the year.
This adds up more than 8 billion heart-shaped candies annually.
Source: New England Confectionery Company
A 2009 study from Nielsen research showed that Valentines week accounts for more than 5 percent of annual chocolate sales.
Source: Nielsen
An interactive map allows users to explore Valentine's customs around the world.
|
| Interactive Valentines Map |
CONSUMER SPENDING
Valentine's Day spending in the United States is expected to top $17.6 billion, according to new survey results released by the National Retail Federation.
Spending is expected to be highest on jewelry ($4.1 billion) followed by $3.5 billion on a date, $1.8 billion on flowers, $1.5 billion on candy, with the balance accounted for by clothing, gift cards, and other items.
That works out to $126 per person celebrating the holiday. This is an 8.5 percent increase over spending in 2012, and the highest in the survey's decade-long history.
"...the average person planning to spend $74.12 on their spouse or significant other, up from $68.98 last year. Additionally, consumers will spend and average of $25.25 on their children, parents or other family members and $6.92 on friends. Valentine’s Day is a great day for pet owners to show their furry friends just how much they mean: the average person will spend about $4.52 on their pets."Source: National Retail Federation 2012 Valentine’s Day Consumer Intentions and Actions survey
FLOWER POWER
U.S. producers sold more than $18 million in cut roses in 2011 (estimated wholesale value for all operations with $100,000 or more in sales).
Source: USDA National Agricultural Statistics Service Floriculture Crops 2011 Summary
To support holiday spending, shoppers can choose from nearly 24,000 jewelry stores and more than 16,000 florists nationwide.
Source: U.S. Census Bureau, County Business Patterns
SWEET TOOTH
To satisfy millions of sweet-toothed customers, the NECCO candy company produces approximately 100,000 pounds of Sweethearts conversation hearts each day for 11 months of the year.
This adds up more than 8 billion heart-shaped candies annually.
Source: New England Confectionery Company
A 2009 study from Nielsen research showed that Valentines week accounts for more than 5 percent of annual chocolate sales.
Source: Nielsen
Tuesday, February 12, 2013
Race, culture, and data of Mardi Gras
 Laissez les bon temps rouler!
Sociological Images has a series of several intriguing posts about Mardi Gras from a social and cultural perspective. Here is a sample of their posts:
- Race and Mardi Gras in Mobile, AL
- Mardi Gras Krewes, tourism, and segregation
- Where the beads come from
The Atlantic Cities profiles "the largest street fair on the planet," with an estimated 6 million revelers at Carnaval in Brazil:
"There will be 14,454 policemen and 985 traffic guards on duty this Carnaval. 1,050 urban cleaning workers will collect over 600 tons of trash... 'Operation Dry Law' ticketed 786 drunk drivers; and the 'Shock of Order' seized 3,700 cans of beer, 1,100 bottles of water, 71 coolers, costumes, spray foam and cigarettes from unlicensed street vendors."
And the Census Bureau is tweeting (@uscensusbureau) about king cake and other Mardi Gras facts and figures.
 |
| Source: U.S. Census Bureau twitter feed |
Wednesday, November 21, 2012
Facts about the Thanksgiving feast
Facts and figures for the fourth Thursday in November...
AND AWAY WE GO!
43.6 million Americans (about 14 percent of the total US population) will travel at least 50 miles from home over Thanksgiving weekend. This represents just under a 1 percent increase in total holiday weekend trips, compared with 2011, and is the fourth consecutive year of increasing holiday travel, according to a report released by AAA.
.jpg) Auto travel accounts for the lion's share (90 percent) of those trips. Despite notoriously long lines at the airport, only 8 percent of holiday travelers plan to fly, and the remaining 2 percent will travel via train, bus, or other mode.
Auto travel accounts for the lion's share (90 percent) of those trips. Despite notoriously long lines at the airport, only 8 percent of holiday travelers plan to fly, and the remaining 2 percent will travel via train, bus, or other mode.
About half of long-distance travelers (those going 50 miles or more) will make a day trip of it. The other half will spend an average of three nights away from home.
Despite increased travel, people plan to spend less, with estimated travel costs ringing in just under $500 per traveler in 2012 compared with just over $550 the prior year.
FACTS ABOUT THE FEAST:
 The average American consumes 13.3 pounds of turkey each year, according to data from the U.S. Census Bureau.
American farmers have raised about 250 million turkeys in 2012, with six top turkey-producing states accounting for nearly two thirds of the total.
With respect to traditional American Thanksgiving side dishes, U.S. growers produced more than 384,000 tons of cranberries, 550,000 tons of pumpkins, 672,000 tons of green beans, and a whopping 1,350,000 tons of sweet potatoes in the past year.
That said, even with a large domestic crop of sweet potatoes, the United States still imports $5.6 million dollars worth, or nearly half of all imported sweet potatoes, from the Dominican Republic.
HAPPY THANKSGIVING!
AND AWAY WE GO!
43.6 million Americans (about 14 percent of the total US population) will travel at least 50 miles from home over Thanksgiving weekend. This represents just under a 1 percent increase in total holiday weekend trips, compared with 2011, and is the fourth consecutive year of increasing holiday travel, according to a report released by AAA.
.jpg) Auto travel accounts for the lion's share (90 percent) of those trips. Despite notoriously long lines at the airport, only 8 percent of holiday travelers plan to fly, and the remaining 2 percent will travel via train, bus, or other mode.
Auto travel accounts for the lion's share (90 percent) of those trips. Despite notoriously long lines at the airport, only 8 percent of holiday travelers plan to fly, and the remaining 2 percent will travel via train, bus, or other mode.About half of long-distance travelers (those going 50 miles or more) will make a day trip of it. The other half will spend an average of three nights away from home.
Despite increased travel, people plan to spend less, with estimated travel costs ringing in just under $500 per traveler in 2012 compared with just over $550 the prior year.
FACTS ABOUT THE FEAST:

American farmers have raised about 250 million turkeys in 2012, with six top turkey-producing states accounting for nearly two thirds of the total.
With respect to traditional American Thanksgiving side dishes, U.S. growers produced more than 384,000 tons of cranberries, 550,000 tons of pumpkins, 672,000 tons of green beans, and a whopping 1,350,000 tons of sweet potatoes in the past year.
That said, even with a large domestic crop of sweet potatoes, the United States still imports $5.6 million dollars worth, or nearly half of all imported sweet potatoes, from the Dominican Republic.
HAPPY THANKSGIVING!
Wednesday, October 24, 2012
Freaky facts and scary stats for Halloween
Terrifying treats:
America's candy consumption in 2010 was nearly 25 pounds per person. If this candy were entirely Snickers bars, it would be the equivalent of nearly candy 4 bars, per week, per person.
 Candy consumption, much like home price, peaked in the middle of the decade, dipped at the start of the recession in 2008, and has been increasing slowly each year since then.
Source: U.S. Census Bureau, Current Industrial Reports, Confectionery: 2010
Sweet tooth:
American confectionery manufacturers produce about 35 million pounds of candy corn each year. That adds up to 9 billion candy corns - or about 30 kernels per person in the U.S.
Source: National Confectioners Association
Little ghouls and goblins:
There were an estimated 41 million potential trick-or-treaters (children age 5-14*) in the United States in 2011.
Source: U.S. Census Bureau, Facts for Features
*Note: Of course, many other children - older than 14, and younger than 5 - also go trick-or-treating.
Pumpkin patch:
U.S. pumpkin production totaled 1.1 billion pounds, in 2010, with a value of $113 million. Six states are pumpkin hotspots: Illinois, California, New York, Ohio, Pennsylvania and Michigan each accounted for more than 100 million pounds of pumpkins grown in 2010.
Sources: USDA National Agricultural Statistics
A BOOming industry:
According to the 2012 BIGinsight survey, the average American adult will spend nearly $80 on decorations, costumes and candy, this Halloween, up from $72 last year. Total Halloween spending is expected to reach $8.0 billion.
Source: National Retail Federation
America's candy consumption in 2010 was nearly 25 pounds per person. If this candy were entirely Snickers bars, it would be the equivalent of nearly candy 4 bars, per week, per person.

Source: U.S. Census Bureau, Current Industrial Reports, Confectionery: 2010
Sweet tooth:
American confectionery manufacturers produce about 35 million pounds of candy corn each year. That adds up to 9 billion candy corns - or about 30 kernels per person in the U.S.
Source: National Confectioners Association
Little ghouls and goblins:
There were an estimated 41 million potential trick-or-treaters (children age 5-14*) in the United States in 2011.
Source: U.S. Census Bureau, Facts for Features
*Note: Of course, many other children - older than 14, and younger than 5 - also go trick-or-treating.
Pumpkin patch:
U.S. pumpkin production totaled 1.1 billion pounds, in 2010, with a value of $113 million. Six states are pumpkin hotspots: Illinois, California, New York, Ohio, Pennsylvania and Michigan each accounted for more than 100 million pounds of pumpkins grown in 2010.
Sources: USDA National Agricultural Statistics
A BOOming industry:
According to the 2012 BIGinsight survey, the average American adult will spend nearly $80 on decorations, costumes and candy, this Halloween, up from $72 last year. Total Halloween spending is expected to reach $8.0 billion.
Source: National Retail Federation
Monday, December 19, 2011
Festive facts for the holidays
The winter holiday season often means travel, shopping, and eating...
Here are the numbers behind the holidays:
DECKING THE HALLS:
Americans will purchase 34.5 million Christmas trees this year. More than one third of those trees will be artificial, according to a survey conducted by Nielsen for the American Christmas Tree Association.
The survey "also found 11 percent of U.S. households who will display a real tree will also display an artificial tree, recognizing a growing trend toward celebrating Christmas with more than one Christmas tree."
The U.S. also produces $1.5 billion worth of candles each year. Those candles come in handy for Hanukkan, Kwanzaa, and Christmas celebrations.
AND AWAY WE GO!
91.9 million Americans (about one third of the total US population) will travel at least 50 miles from home over the winter holiday season (Dec 23 - Jan 2). This represents a 1.4 percent increase in total holiday travel, compared with 2010, according to an annual report released by AAA.
Auto travel accounts for the lion's share (90 percent) of those trips. Despite notoriously long lines at the airport, only 8 percent of holiday travelers plan to fly, and the remaining 2 percent will travel via train, bus, or other mode.
About half of long-distance travelers (those going 50 miles or more) will make a day trip of it. Travelers who plan to stay overnight at their destinations will spend an average of four nights away from home.
SHOP 'TIL YOU DROP:
Most retail stores do the bulk of their yearly business in December. For retail stores overall, 14 percent of annual sales occur in the last month of the year. For jewelry stores, December makes up 20 percent of annual sales.
Total retail sales for the holiday season are expected to reach nearly $470 billion. And for those who want to avoid the malls, $34 billion of December 2010 retail sales were online or mail-order.
SANTA NEEDS HELPERS...
$2.5 billion
worth of toys (including stuffed toys, dolls, puzzles, and electric trains) were imported to the U.S. from China between January and September 2011. China also leads the pack in U.S. imports of ice skates ($17.7 million) and basketballs ($38.9 million).
Within the U.S. there are about 8,000 workers across 579 locations that primarily manufacture toys and games. Is it any surprise that Santa needs 8,000 helpers?
HOLIDAY TREATS:
If you're making latkes for Hanukkah, chances are the potatoes come from Idaho or Washington. 50 percent of the nation's 'taters were grown in those two states, according to the U.S. Census Bureau.
U.S. farmers produced 2.01 billion bushels of wheat - crucial for making Christmas cookies - in 2011. Kansas, Montana and North Dakota accounted for about a third of the nation's wheat production.
But while Americans eat plenty of cookies, you might as well hold the eggnog. Nationwide consumption averages only half a cup per capita, according to figures from Indiana University.
Candy canes might be a holiday staple, but chocolate is a nearly universal gift. The winter holidays represent the biggest boxed chocolate selling season as 70 percent of adults in the U.S. give or receive a box of chocolates during the holidays.
Here are the numbers behind the holidays:
 |
| Types of Christmas trees purchased in 2011, based on data from the Christmas Tree Association and author's calculations |
The survey "also found 11 percent of U.S. households who will display a real tree will also display an artificial tree, recognizing a growing trend toward celebrating Christmas with more than one Christmas tree."
The U.S. also produces $1.5 billion worth of candles each year. Those candles come in handy for Hanukkan, Kwanzaa, and Christmas celebrations.
AND AWAY WE GO!
 |
| New Orleans Holiday Travel (author's photo) |
Auto travel accounts for the lion's share (90 percent) of those trips. Despite notoriously long lines at the airport, only 8 percent of holiday travelers plan to fly, and the remaining 2 percent will travel via train, bus, or other mode.
About half of long-distance travelers (those going 50 miles or more) will make a day trip of it. Travelers who plan to stay overnight at their destinations will spend an average of four nights away from home.
SHOP 'TIL YOU DROP:
Most retail stores do the bulk of their yearly business in December. For retail stores overall, 14 percent of annual sales occur in the last month of the year. For jewelry stores, December makes up 20 percent of annual sales.
Total retail sales for the holiday season are expected to reach nearly $470 billion. And for those who want to avoid the malls, $34 billion of December 2010 retail sales were online or mail-order.
SANTA NEEDS HELPERS...
 |
| Photo courtesy of State Library and Archives of Florida |
Within the U.S. there are about 8,000 workers across 579 locations that primarily manufacture toys and games. Is it any surprise that Santa needs 8,000 helpers?
HOLIDAY TREATS:
If you're making latkes for Hanukkah, chances are the potatoes come from Idaho or Washington. 50 percent of the nation's 'taters were grown in those two states, according to the U.S. Census Bureau.
U.S. farmers produced 2.01 billion bushels of wheat - crucial for making Christmas cookies - in 2011. Kansas, Montana and North Dakota accounted for about a third of the nation's wheat production.
But while Americans eat plenty of cookies, you might as well hold the eggnog. Nationwide consumption averages only half a cup per capita, according to figures from Indiana University.
Candy canes might be a holiday staple, but chocolate is a nearly universal gift. The winter holidays represent the biggest boxed chocolate selling season as 70 percent of adults in the U.S. give or receive a box of chocolates during the holidays.
Sunday, November 20, 2011
Thanksgiving by the numbers
Holiday data roundup for the fourth Thursday in November.
AND AWAY WE GO!
42.5 million Americans (about 14 percent of the total US population) will travel at least 50 miles from home over Thanksgiving weekend. This represents a 4 percent increase in total holiday weekend trips, compared with 2010, but remains well below the peak in 2005 according to an annual report released by AAA.

Auto travel accounts for the lion's share (90 percent) of those trips. Despite notoriously long lines at the airport, only 8 percent of holiday travelers plan to fly, and the remaining 2 percent will travel via train, bus, or other mode.
About half of long-distance travelers (those going 50 miles or more) will make a day trip of it. The other half will spend an average of three nights away from home.
IT'S ALL ABOUT THE FOOD:
 13.3 pounds of turkey are consumed by the average American each year, according to data from the U.S. Census Bureau.
248 million turkeys were raised in the United States in 2011, up 2 percent from the prior year. U.S. turkey production for 2010 was valued at $4.37 billion. And, according to the Bureau of Labor Statistics, the retail price per pound of turkey is lowest in November.
750 million pounds of cranberries were grown in the U.S. in 2011. Wisconsin grows the most (430 million pounds) followed by Massachusetts (210 million pounds).
2.4 billion pounds of sweet potatoes and 1.1 billion pounds of pumpkins were grown in the United States in 2010. No stats are available on how many are baked into pies.
WHEN WE'RE NOT EATING WE'RE _____:
A poll by Harris Interactive found that more than half of working Americans (59 percent) report checking their work email on major holidays such as Thanksgiving and Christmas.
While many retailers tried to get a jump on the holiday shopping season this year, there is a clear spike in retail jobs each year from November to December. This should come as no surprise since about half of Americans spend time shopping on Thanksgiving weekend.
AND AWAY WE GO!
42.5 million Americans (about 14 percent of the total US population) will travel at least 50 miles from home over Thanksgiving weekend. This represents a 4 percent increase in total holiday weekend trips, compared with 2010, but remains well below the peak in 2005 according to an annual report released by AAA.

Auto travel accounts for the lion's share (90 percent) of those trips. Despite notoriously long lines at the airport, only 8 percent of holiday travelers plan to fly, and the remaining 2 percent will travel via train, bus, or other mode.
About half of long-distance travelers (those going 50 miles or more) will make a day trip of it. The other half will spend an average of three nights away from home.
IT'S ALL ABOUT THE FOOD:
 13.3 pounds of turkey are consumed by the average American each year, according to data from the U.S. Census Bureau.
248 million turkeys were raised in the United States in 2011, up 2 percent from the prior year. U.S. turkey production for 2010 was valued at $4.37 billion. And, according to the Bureau of Labor Statistics, the retail price per pound of turkey is lowest in November.
750 million pounds of cranberries were grown in the U.S. in 2011. Wisconsin grows the most (430 million pounds) followed by Massachusetts (210 million pounds).
2.4 billion pounds of sweet potatoes and 1.1 billion pounds of pumpkins were grown in the United States in 2010. No stats are available on how many are baked into pies.
WHEN WE'RE NOT EATING WE'RE _____:
A poll by Harris Interactive found that more than half of working Americans (59 percent) report checking their work email on major holidays such as Thanksgiving and Christmas.
While many retailers tried to get a jump on the holiday shopping season this year, there is a clear spike in retail jobs each year from November to December. This should come as no surprise since about half of Americans spend time shopping on Thanksgiving weekend.
Saturday, November 5, 2011
The numbers behind the NYC Marathon
45,000 runners
+ 26.2 miles
+ 5 boroughs
+ 32,000 gallons of gatorade
+ 1 Sunday in November
= 1 NYC Marathon
Occasionally my two loves (running and data) come together in perfect harmony. This weekend is one of those times. In honor of the ING New York City Marathon, here are some eye-opening stats about the race.
Who's running:
 In 2011 the race is more than 350 times larger than it was its inaugural year. In 1970, according to marathon organizers, "127 runners paid the $1 entry fee to NYRR to participate in a 26.2-mile race... Fifty-five runners crossed the finish line."
On Nov. 6, 2011 officials expect 45,000 runners to toe the starting line. To put that in perspective, there will be one NYC Marathon runner for every resident of Olympia, WA (or Harrisburg, PA - for those in the eastern time zone).
Of those 45,000 runners:
Who's making it happen:
According to Wolfram|Alpha "to help energize and hydrate the runners before the race begins" organizers will provide runners with:
On Sunday, more than 1,600 portable toilets will be available for the runners. That works out to about one port-o-potty for every 28 runners, but you know the lines will be longer than that!
Data Sources:
ING New York City Marathon website
Running Trip "NYC Marathon by the numbers"
Running USA Annual Marathon Report (2011)
The Weather Channel
Wolfram|Alpha
+ 26.2 miles
+ 5 boroughs
+ 32,000 gallons of gatorade
+ 1 Sunday in November
= 1 NYC Marathon
Occasionally my two loves (running and data) come together in perfect harmony. This weekend is one of those times. In honor of the ING New York City Marathon, here are some eye-opening stats about the race.
Who's running:

On Nov. 6, 2011 officials expect 45,000 runners to toe the starting line. To put that in perspective, there will be one NYC Marathon runner for every resident of Olympia, WA (or Harrisburg, PA - for those in the eastern time zone).
Of those 45,000 runners:
- The sex ratio is 1.63:1.00 (62% men / 38% women, which is similar to the 2010 average for marathons nationwide which showed a 59/41 split)
- One third are between the ages of 40 and 49.
- The oldest male entrant is 87. The oldest female is 84.
- The race's 26.2 miles traverse all five of New York's boroughs.
- The highest elevation along the course (approx 260 feet above sea level) occurs in the first mile, on the Verrazano Narrows bridge.
Who's making it happen:
- More than 150 New York Road Runners staff work year-round on the marathon.
- There are more than 8,000 volunteers for the event.
- 130 bands will serenade the runners.
- The week before the race, 100 people worked to clean up the post-snowstorm debris in Central Park that was blocking the race course.
According to Wolfram|Alpha "to help energize and hydrate the runners before the race begins" organizers will provide runners with:
- 42,000 Power Bars
- 90,000 bottles of water
- 45,000 cups of coffee
On the course, there will be:
And with all that hydration (plus race-day nerves), expect long bathroom lines:- 62,370 gallons of water
- 32,040 gallons of Gatorade
On Sunday, more than 1,600 portable toilets will be available for the runners. That works out to about one port-o-potty for every 28 runners, but you know the lines will be longer than that!
Data Sources:
ING New York City Marathon website
Running Trip "NYC Marathon by the numbers"
Running USA Annual Marathon Report (2011)
The Weather Channel
Wolfram|Alpha
Subscribe to:
Posts (Atom)